First things first, we’re all about that data. And from time to time, Gridium users ask us about the means and methods we use to capture the data, analyze, interpret, visualize, and summarize the data, and even soothe our children to sleep with the data. Frequent readers will know our big data analytics platform doesn’t require any hardware in your building’s mechanical room nor programs loaded onto your BMS, but we’ve recently received a few questions about our weather data and so we decided to dig in and share the results of our review.
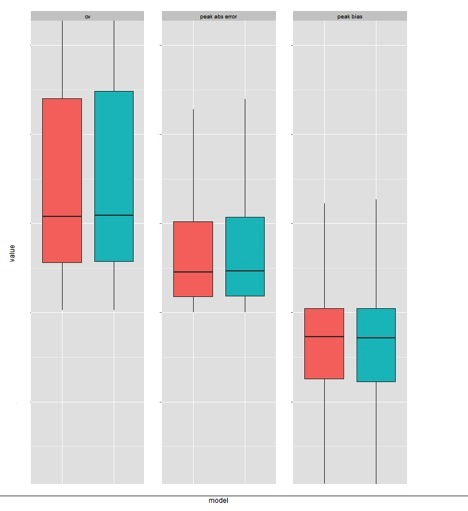
This chart shows minimal difference in the accuracy of predicted energy use (based on the coefficient of variation, demand peak absolute error and demand peak bias) across two different weather data sources.
Gridium uses weather data and weather forecasts as ingredients in a larger recipe designed to predict your building’s energy use. Many people cast a skeptical eye on the weatherman’s report, but it’s useful to suspend this skepticism for a moment to learn how specific components of weather data inform the individual statistical model Gridium’s software creates–and continuously updates–for your building. Your model is “trained” on actual, historical weather readings paired with the building’s smart meter interval data (typically meaning a few years of actual weather readings). No errant weatherman forecasts there.
Additionally, Gridium’s analytics use both dry bulb and wet bulb temperature data. And when Gridium’s analytics require weather forecasts, it uses rolling 7 day forecasts, which are more accurate than monthly forecasts. The story gets better: for the purposes of peak demand predictions, the accuracy of the predictions are influenced much more by the tendency of the weather forecast to correctly call hot days as hot days and cooler days as cooler days, not whether next Thursday is going to be 89 degrees or 92 degrees. Put another way, the accuracy of peak predictions is driven chiefly by the hotter or cooler day type forecasts, and not spot-on degree forecasts. These 7 day forecasts are typically quite accurate at calling day type. Furthermore, your model adjusts to local climate conditions by “learning” how your building responds to changes in weather over time. These self-taught adjustments are particularly effective when changes in local weather conditions are consistent through time.
Weather data comes in many flavors. There is historical weather data, current weather readings, and weather forecasts. This data can be sourced from government agency monitoring stations at airports, private weather stations, or private weather data companies who layer in additional data streams–like radar–to further interpolate the weather data for finer granularity. We are constantly looking for both better modeling techniques and better sources of data, and we use our Gridium Labs analytics platform to run R&D projects. This analysis of the effects on model accuracy driven by changing weather data sources (pictured above) is one simple example. Another simple example is our comparison of zip code level weather data streams to region-specific airport weather station data:
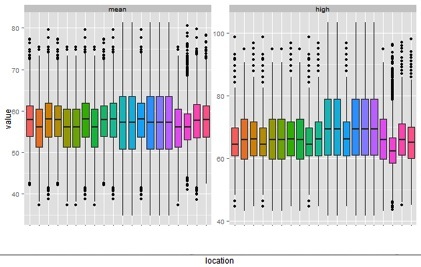
This box and whisker plot shows little variability between these different weather data streams. The boxes indicate the middle 50% of temperature readings, the middle line shows the median value, the “whiskers” span 95% of values, and the dots indicate outliers.
In our effort to test the effects of different weather data on your building’s predicted energy use, we used Gridium labs to run over 15,000 summertime evaluation periods (and the results are summarized in the chart at the top of this post). Our weather and interval database spans more than 5 years, so this analysis included evaluation periods from hot, cool, and standard summers. These evaluation periods reflect individual building models trained on 52 weeks of actual, historic weather data and then the model is presented with the forecast from the 53rd week. The resulting prediction on energy use and peak is compared to the actual, historic energy data from that 53rd week. No material improvement was found between to the two weather data sources.
Is this surprising? No. And that brings us to our final point.
When it comes to predicting how your building uses energy, the two most important factors to understand are (1) your building’s baseload, and (2) the “scheduled load” representing how your building uses energy when it ramps up during the day and down at night. Weather is the 3rd most meaningful factor. This doesn’t mean it’s not important: baseload and scheduled load get the prediction to the goal line, and weather takes it across.
If you have more questions about how your building responds to changes in the weather, please let us know.
