Building drift is a fact of life. Building systems are simply too complex to remain static. Over time, energy use increases or decreases in response to tenant behavior, equipment problems, controls issues, or a host of other factors that can affect building performance.
An ongoing theme at Gridium is using weather normalization to pull a signal out of the energy noise. Only by stripping out the effects of temperature, humidity, and other external factors can you see the underlying operational trends.
Today we’re pleased to show you just how precisely such weather-adjusted models can characterize operational drift in your building. Behold the drift report, a feature of our recently launched Billcast product that helps facility managers visualize not just how much their building has drifted, but precisely how building behavior has changed.
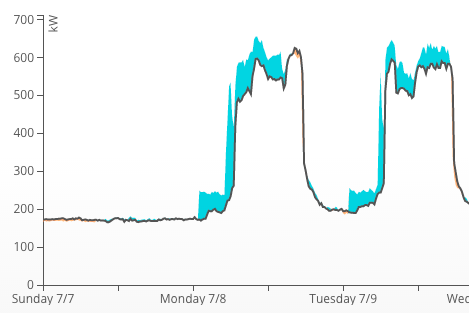
Check out the chart up top, taken from a real Gridium customer. The gray line represents demand over the course of last week. The blue shaded areas represent operational savings from the previous year. The orange areas represent operational increases. It’s important to stress that the shaded areas represent operational changes only — all weather effects have been removed.
Every drift report tells a story. The chart above shows several changes in the behavior of the building:
- Weekday startup has been shifted back by about an hour.
- Peak weekday energy use has increased on most days by about 15 kW.
- The facility successfully addressed a controls issue that was causing Friday energy use to be significantly higher than other weekdays.
- Weekend baseload has been trimmed, including some mid-day spikes.
By characterizing operational changes at the 15-minute level, drift reports provide far more precise operational feedback. In the past, if you wanted to experiment with different controls strategies, you had no good way to tell if your changes were having an effect. Small adjustments are usually too subtle to show up in individual energy bills, particularly when obscured by variations in weather. Normalization helps a lot, but even after weather noise is stripped out, you still might be left with a variety of confounding effects, such as occupancy changes or equipment issues.
Drift reports characterize operational changes definitively. The example above shows the results of a controls update meant to shift start time back and reduce mid-day demand. Notice that weekend baseload is amazingly steady year on year, as is weekday shutdown. The change in energy use is precisely limited to the morning start and weekday operating load, just as the engineer intended. The feedback is immediate and precise.
How might drift reports help you better manage your building?
